

Explore our pound to rand forecast, including GBP/ZAR scenarios, interest-rate drivers, key technical levels and practical CFD trading examples and risks.

Explore the CoreWeave stock forecast for 2026 and 2030 through AI cloud demand, debt, data centre leases, dilution and bull, base and bear valuation scenarios.
Explore our Nebius stock price prediction for 2026, 2027 and 2030. Compare bull, base and bear scenarios based on AI cloud revenue, debt, dilution and valuation.
Eli Lilly Stock Forecast for 2026–2030: explore LLY’s $1,300 hurdle, obesity-drug growth, valuation risks and bull, base and bear scenarios for stock traders.

Is Tesla a good stock to buy? Explore earnings, AI growth, robotaxi potential and valuation risks, plus the differences between Tesla shares and CFD trading.

Explore our Bitcoin price prediction for end-2026, with bull, base and bear scenarios, key price drivers, technical levels and practical CFD trading risks.

Are memory stocks still a buy? Compare leading companies, AI demand, chip pricing and valuation risks, plus practical CFD trading examples after the selloff.

Is Oracle a good buy? Assess Oracle stock valuation, AI cloud growth, cash flow, debt and long-term risks, plus share ownership versus CFD trading costs.
Compare nine stock CFD brokers in 2026, including Markets.com, IG and Pepperstone. Explore share CFDs, 24/7 trading, platforms, fees and risks.

Is SpaceX a good stock to buy in 2026? Explore its Starlink, launch and AI growth, valuation, analyst targets, risks and ways to trade SPCX.

What is the best gold stock to buy now? Compare six leading gold shares for 2026, including miners, streamers, key metrics, risks and CFD trading.
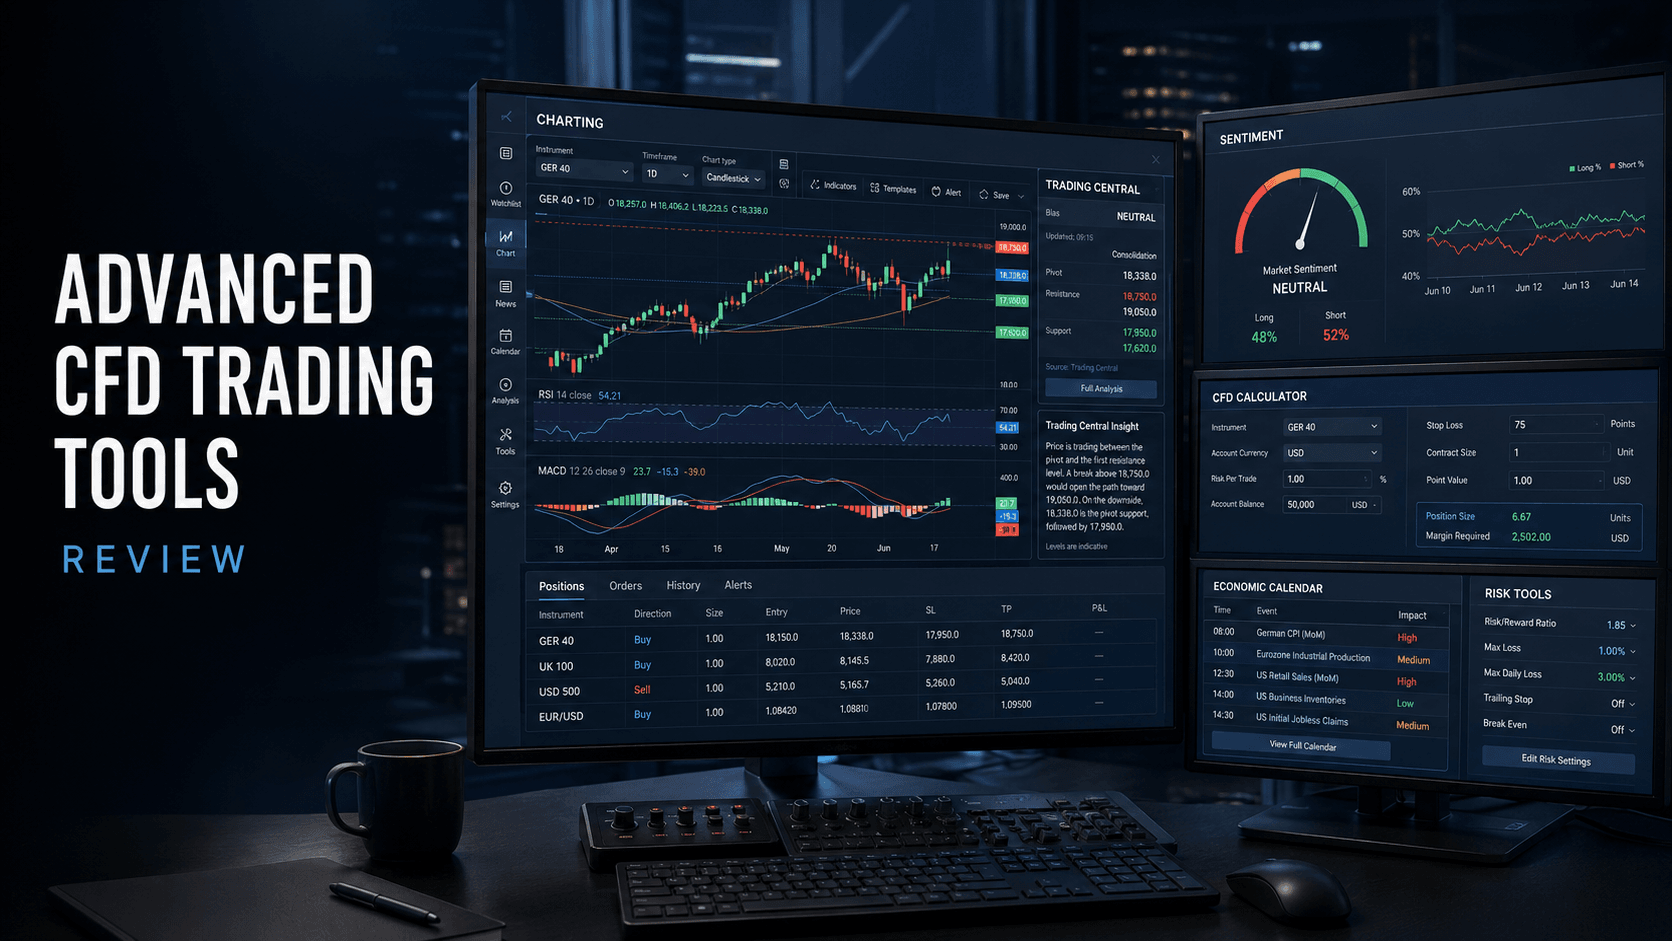
Read our advanced CFD trading tools review covering charting, Trading Central, sentiment analysis, CFD calculators, economic calendars and risk tools.

Gold price today trades near $4,015 after Thursday’s sell-off, with the $4,000 level, Treasury yields and October Fed meeting in focus.
The Nasdaq fell 2.6% in its worst session since June as AI spending concerns weighed on tech stocks. The S&P 500 declined while the Dow held steady.

Moderna shares fell 17.6% after leaked melanoma vaccine data showed a 42% reduction in recurrence or death risk. ESMO and Q3 earnings are next.
Trading earnings starts with knowing what to look for. Learn how to read company results, plan trades before or after reports, and manage the risks of CFDs.

Is the AI bubble bursting in 2026? Examine warning signs, AI spending, valuations, possible triggers and what a downturn could mean for stocks.
Compare the best FTSE 100 shares to buy now, explore valuations, dividends and key risks, and learn how share investing differs from CFD trading on Markets.com.





