


Qatar Stock Exchange (QSE) analysis: The Qatar Stock Exchange is one of the leading financial markets in the Middle East.
CFD Trading for Beginners in Egypt: More beginner traders are entering the global financial markets through CFD platforms because they offer access to forex, stocks, indices, gold, oil, and other financial instruments from a single account.

Shiba Inu Price Prediction: Shiba Inu, commonly known as SHIB, has become one of the most recognized cryptocurrencies in the world.

Which Broker Is Best in the UAE: The UAE has become one of the fastest-growing trading hubs in the Middle East, attracting both beginner and professional investors looking for access to forex, CFDs, stocks, commodities, and cryptos.

SOUN stock analysis: SoundHound AI has expanded beyond its original identity as a voice-recognition company.

Silver price XAGUSD forecast: Silver has become one of the most closely watched assets in global financial markets.
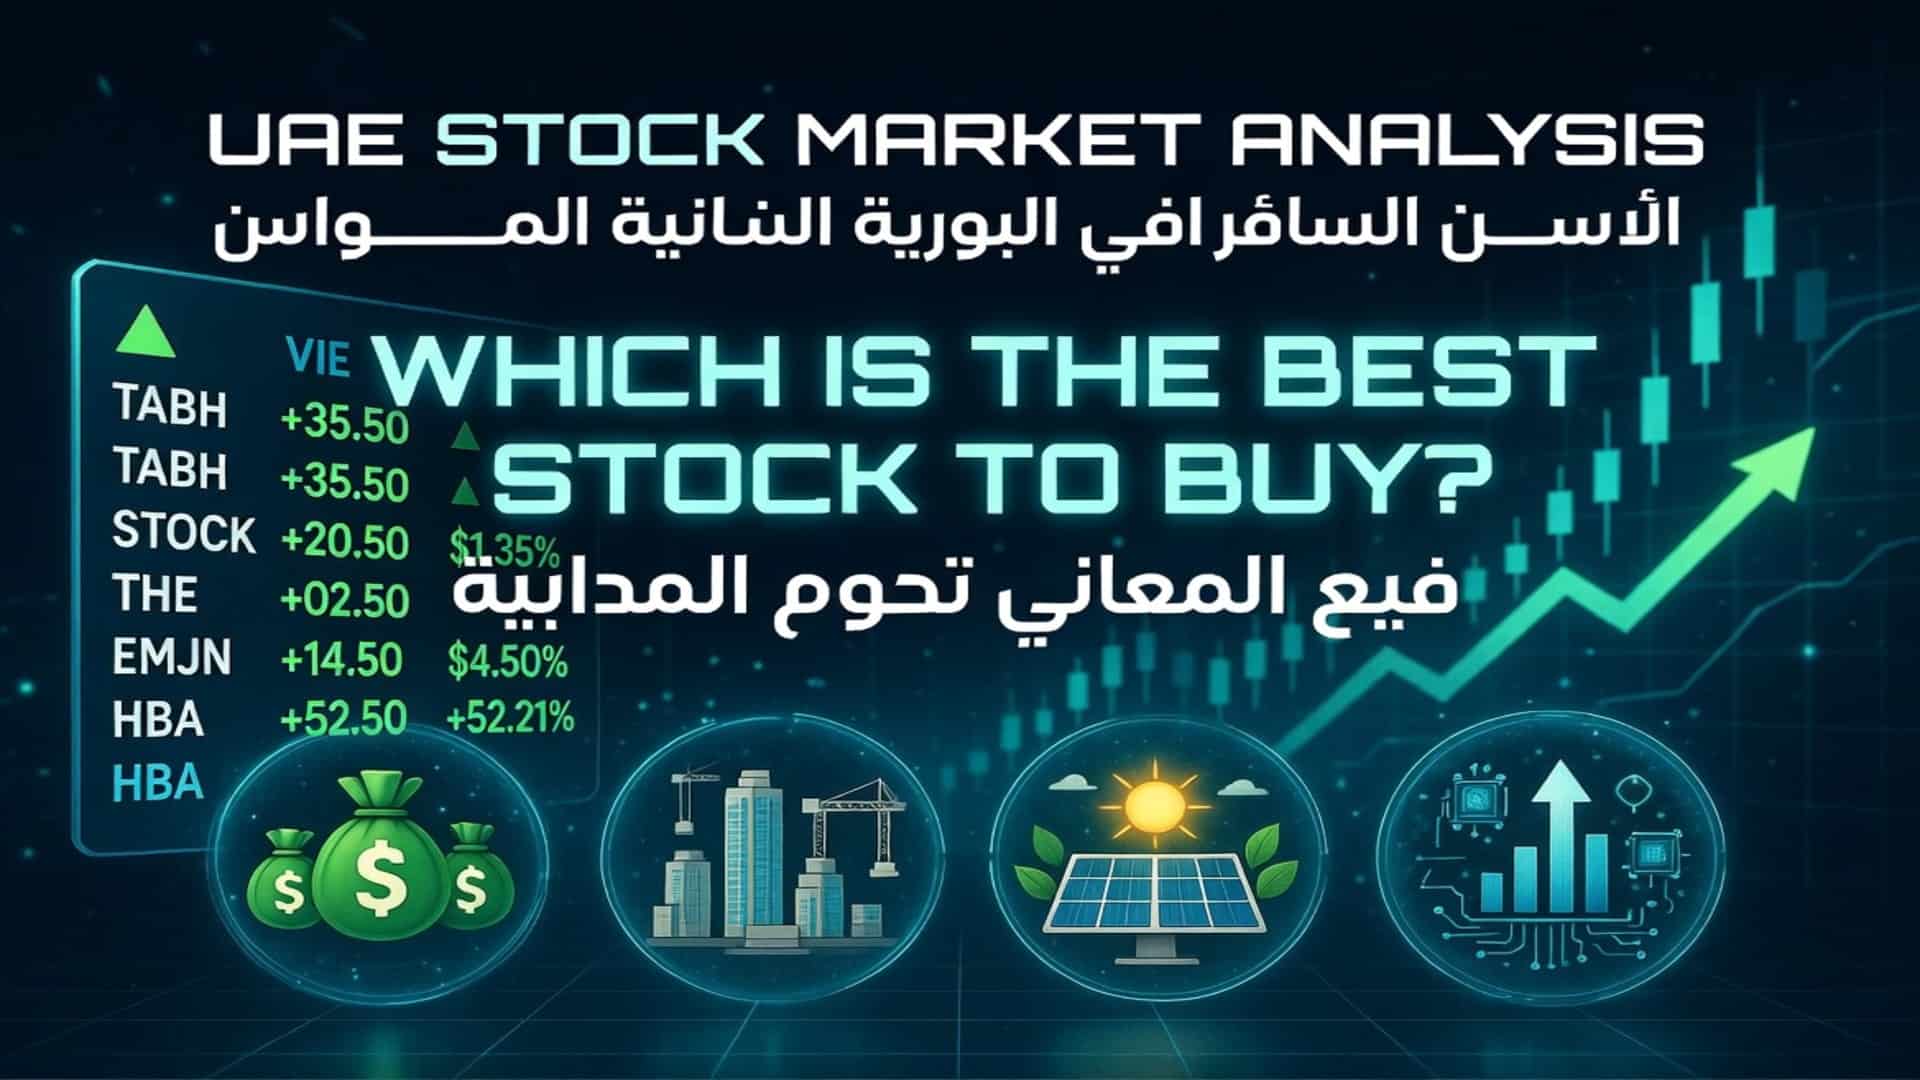
UAE stock market analysis: The United Arab Emirates has transformed into one of the most influential financial hubs in the Middle East.

Top 10 forex brokers in South Africa for beginners: South Africa has become one of the most active forex trading markets in Africa, with thousands of new traders entering the market every year.

Dow Jones Index today analysis: The Dow Jones Industrial Average remains one of the most influential stock market indices in the world.

Palantir Stock Price Prediction 2030: Palantir Technologies has become one of the most talked-about artificial intelligence firms in global markets.

Why South African Investors Love QQQ ETF: In recent years, South African investors have become increasingly interested in international investing.
Is Dubai using XRP: Dubai has positioned itself as one of the most crypto-friendly financial hubs in the world.

DJT Stock Today: DJT shares moved lower after Trump Media & Technology Group posted a massive first-quarter loss, raising new concerns about the company’s financial direction and long-term business strategy.

Gold Price Today: Gold prices remained steady on May 19, trading within the 4,560-4,580 range as investors continued to balance safe-haven demand with cautious market sentiment.

Stellar XLM news today: Stellar’s native token XLM gained attention this week as the network’s decentralized finance ecosystem reached a significant milestone.

Discover the 10 most common trading mistakes and learn how to avoid them with practical strategies, risk management tips, and expert insights.

Discover what an IPO is, how Initial Public Offerings work, and why companies go public. Learn key IPO trading strategies, risks, and how to trade listing-day volatility.

Learn how to trade Amazon stock step by step, including CFDs, strategies, risks, and key price drivers. A complete beginner-friendly trading guide.


